VFR Charts

It is impossible to navigate without a chart.
In the first days of air transportation, airways only connected major cities. In the daytime pilots navigated along these airways with dead reckoning and after dark followed a series of flashing beacons spaced about ten miles apart.
The first aviation charts were strip charts, and displayed an 80-mile wide corridor about these established airways. Adequate if one remained on the airways, pilots reached for a road map if they had to deviate from their course because of storms, or needed to fly to a destination not on a primary route. Or if they got lost.
In 1930, area charts were developed to provide coverage for the entire United States. These charts divided the now lower 48 states into 87 sections. They have since been reprinted on two-sides and now 37 sectional charts cover the same area.
The Sectional Chart
The Sectional Chart is for VFR flight only. Canadians have their VNC, the VFR Navigation Chart.
Each Sectional Aeronautical Chart carries the name of a principal city within its coverage area. Hence the New York Sectional, or the Miami Sectional, or the Chicago Sectional, etc.
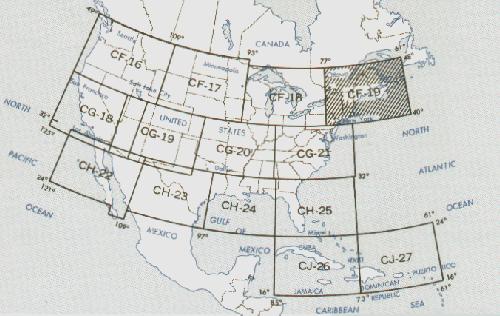
Here are the available U.S. sectionals for the "lower 48" and their coverage area. Note that the New York sectional coverage area is grayed out. Each chart grays-out its own coverage area so that the user can quickly identify that coverage area.
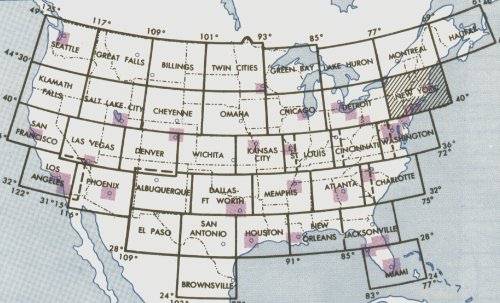
Coverage chart of available sectionals taken from New York Sectional. Click image for larger view.
Notice the shaded rectangles in the illustration that are within some of the coverage areas. They designate Terminal Area Charts, large scale charts for major, congested cities. Features on these charts are the same as on a sectional chart.
Flight-simmers would do well to purchase a sectional chart for the area where they live or an area where they want to "fly." Also buy a Terminal Area Chart if you live near one of those large cities. Both are available at your local airport, or through the Internet (enter "pilot supplies" into your search engine.) Spend some time learning what's on them. It will help you better understand navigation and if you're a flight-sim enthusiast, you'll find them fascinating.
Before delving inside a sectional to begin your flight planning note two things on the chart's front panel: the date of issue and the highest terrain figure.
Sectionals expire six months after their date of issue. Sometimes the changes are small, others are significant like a change in VOR or control tower frequencies. Perhaps a 1000 ft. TV tower was erected near the approach path to your destination airport. Charts are inexpensive, keep them current. The scheduled issue date of the next edition is printed on the front panel of the sectional.
The highest terrain point on a sectional is noted on the front panel of the chart, too, along with its location. Miami sectional's 305 feet is not much of a factor, but you may want to ponder the 6288 feet for the New York sectional.
Sectionals contain a wealth of information. Far too much to fully describe here. The correct time to study a chart in depth is during flight planning, not after the aircraft is in the air. Accident reports indicate that this common-sense rule has not always been followed.
Remember, sectionals are for VFR flight only and so they feature landmarks that are visible from the air: railroads, lakes and rivers, especially prominent buildings, cities, power lines, and towers and other obstructions.
Ground elevations are shown, with the color code for different terrain levels depicted on the front panel.
Naturally, all airports appear on the sectionals. Their symbol color is red if an uncontrolled field (no control tower) or blue if a controlled field. The airport symbols show the runway layouts, too.
The sectionals present an amazing amount of airport information, including the availability of ATIS.
ATIS, Automatic Terminal Information Service, is a recorded announcement broadcast 24 hours a day. This announcement gives the current weather and surface winds, the altimeter setting, active runway in use, frequencies for initial contact with the airport and other advisories, such as if a runway is closed—or the airport is closed! The broadcast information is updated hourly, unless local conditions warrant more frequent updates. Each update is given a letter, and the voice announcement might end with "inform approach control that you have Information Delta."
A portion of the pilot's initial contact with approach control could be "Nantucket, this is Barn-Burner 3343-Alpha (type aircraft and registration number), with Delta."
Normally, that would end the reference to ATIS. On occasion, though, approach control might respond, "Roger 3343-Alpha, radar contact ... Echo is current," lightly slapping the pilot on the wrist for last tuning in ATIS too long prior to initial contact.
Oddly, though, I've never heard approach control utter those words of remonstration when Air Force One initially reports in.
The sectional shows the established airways, called Victor airways, as well as all nav-aids.
Below is an excerpt from the New York sectional centered about the Nantucket, Massachusetts airport. The paragraphs following the image describe many of the features on the chart. I recommend that you click on the image below to print the sectional excerpt (its not color), a pdf file, to use while following the descriptions. If you don't have Adobe's Acrobat Reader, a free program needed to read pdf files, then click here to get that.
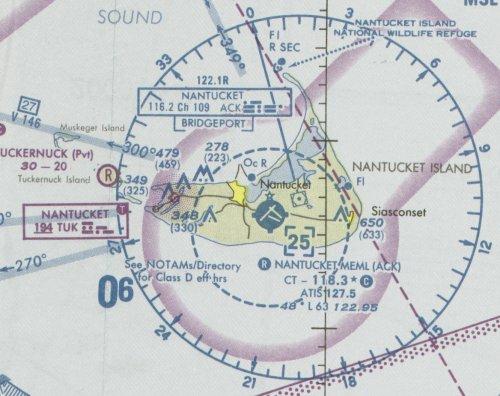
An excerpt of the New York Sectional near the Nantucket, Massachusetts Airport. Click image to download and print the pdf file, then continue below.
Focus on the Nantucket Memorial Airport. The airport symbol is blue, so it's a controlled field. The symbol also shows the orientation of the three runways. The star above the airport symbol indicates that a rotating beacon is present.
Notice the dashed blue circle surrounding the airport symbol. This circle defines the Class D airspace. All aircraft in Nantucket's Class D airspace, which is the surface to 2500 ft. MSL (learned from the "25" in the dashed box), are required to be in radio contact with the tower.
The white "R" in the blue circle before the airport name, Nantucket Memorial, denotes that radar is available.
CT – 118.3 identifies the Control Tower frequency as 118.3 MHz.
ATIS 127.5 is next, which signifies that Automatic Terminal Information Service is available on the field, and at Nantucket it broadcasts on 127.5 MHz.
A number-chain near each airport symbol designates the field elevation, whether runway lighting is available and the length in hundreds of feet of the longest runway.
Nantucket's number chain is 48*L63. The field elevation is 48 feet, it has lighted runways, and the longest runway is 6300 feet. The "star" before the "L" means "some lighting limitations exist—refer to the airport/facility directory." Yep, that's another publication a pilot must buy and keep current—see later for more info.
VORs and NDBs are both shown on a sectional chart. The large compass rose with an arrow pointing towards magnetic north identifies a VOR. A red circle filled with dots portrays an NDB. In this case, both the VOR and the NDB are appropriately named Nantucket.
The navigation box near the top shows Nantucket's VOR frequency is 116.2 MHz. Its identifier is ACK. The Morse code for ACK also appears in this box.
CH 109 is channel 109. Sometime one or two centuries ago, a higher power decided that aviators couldn't handle such complexity as 116.2 MHz. So channel numbers were assigned to the frequencies, thus CH 109 is 116.2 MHz. Surely there is some sort of prize available for the first person to find an aircraft with a Nav receiver that requires channel number settings. If I'm way out in left field on this one, please e-mail me and set me straight. Meanwhile, channel numbers continue to clutter up VOR navigation boxes on charts.
The navigation box to the left, half-way down, identifies the NDB. Its frequency is 194 kHz and the three-letter identifier is TUK. Again the Morse-code is shown. The underline on the frequency means that no voice transmissions are available.
All Victor Airways are marked on sectionals. These are airways defined by VORs, hence the beginning letter of V. Aviation communication extensively uses the phonetic code, so airway V 146 on the 300° radial of the "ACK" VOR would be identified as Victor 146.
The "boxed" 27 above the letters V 146 indicates 27 nautical miles from the "ACK" VOR to the next VOR on the airway.
The bold "06" in the lower left of the illustration is the Maximum Elevation Figure for that grid-square. The large digit(s) on the left, here a zero, is the thousands of feet above MSL and the digit on the right is the hundreds of feet above MSL. For this grid the highest elevation of anything, terrain, obstructions, towers, antennas, etc., is 600 feet MSL. Every grid square on a sectional chart has such a notation.
The inverted "Vs" near the airport symbol are obstructions, usually towers. Two numbers are printed next to these obstructions: its height above sea level, and its actual height in parenthesis. You will note a popular obstruction location is near airports.
Don't bother trying to memorize all these symbols and notations. The ones that you frequently use you will learn quickly enough. You can look the others up on the legend panels of the sectional chart.
Each sectional also shows and lists areas of restricted flight. For example, flight is prohibited over the U.S. Capitol or the White House or the Washington Monument. Surface-to-Air Missiles probably don't await you if you violate that airspace, though. It's the bevy of fast-approaching F-16's flown by pilots who, for the moment, have lost their sense of humor that should cause concern. German pilot Matthias Rust ruined it all in 1987 when he flew his Cessna 172 from Germany to Moscow and landed on the grounds of the Kremlin, undetected by the vaunted Soviet air defense.
The next illustration shows prohibited area P-67, here a circle with inward radial lines.
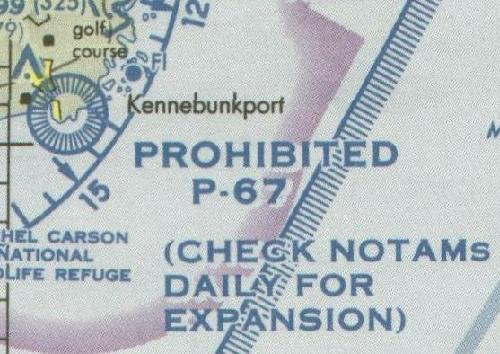
P-67 normally prohibits flight from the surface up to 1000 ft. AGL, unless a certain very important visitor is present.
A pilot should contact a Flight Service Station (FSS) for the latest NOTAMS (Notices To Airmen) if he will be venturing near P-67. It's coverage could greatly expand, and ignorance of that fact is no excuse for being in it.
Next is a Restricted area, R-4105, also enclosed with blue hatched lines.
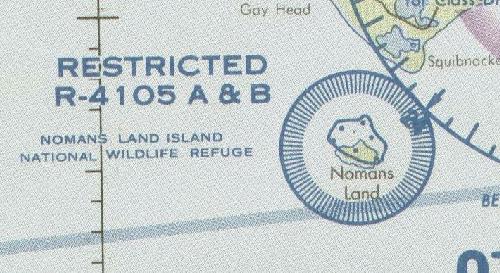
R-4105 protects a national wildlife refuge. This coverage area extends from the surface up to, but not including 18,000 ft.
To overfly R-4105 permission must be requested 48 hours in advance—unless you're at FL180 or above. Just because permission can be requested to overfly a Restricted area doesn't mean it will automatically be granted. The pilot needs a rather compelling reason.
Pilots should also be aware of any Warning Areas in their path of flight. These are identified in the same manner as a prohibited area or a restricted area, with a blue border with hatched lines extending inward.
The notation for Warning Area W-104B should be enough to keep you out:
Warning, National Defense Operating Area. Operations hazardous to the flight of aircraft conducted within this area.
The sectional-chart scale is 1:500,000. That means lay a one-foot ruler on the chart and you will have to pace off 500,000 feet of real ground—almost 95 statute miles—to cover the same distance.
It's only important to know this number because the scale of a Terminal area chart is1:250,000, and the scale of a World Aeronautical Chart is 1:1,000,000. When flight planning, use the proper scale on your plotter when measuring distances. Oh yes, and the sectional-chart scale question has been on the private-pilot written exam for decades.
Terminal Area Charts
Terminal area charts support Sectionals in the same manner that city street maps support state road maps. The Terminal chart is an expanded view of the terrain and aeronautical features in the vicinity of a major city.
Terminal Area Charts usually carry the same name as the sectional. Sometimes a terminal area chart is available for a second city within a sectional chart, such as the Boston Terminal Area Chart in the New York sectional. Terminal area charts are valid for 196 days (someone must have won the lottery on that number).
As already mentioned, a Terminal Area Chart's features are identical with a sectional chart except that they are one-half the scale to show details more clearly.
World Aeronautical Charts
World Aeronautical Charts—WACs—as the name implies, are available for coverage areas extending beyond the U.S. and Canada. You can get them for the U.S. and Canada, too. Again, buy them at your local airport or through the Internet.
World Aeronautical Chart coverage for the United States.
WAC titles are based on the latitude band they are in. Each WAC coverage is nominally an eight-degree latitude band. As you can see, the CJ series is from 16° to 24°, while to the north, the CF series covers 40° to 48°. As in the sectional chart, the area of coverage of each WAC is grayed out on the front panel for quick reference.
WAC features are identical to sectionals, with two exceptions. The scale is one half, already mentioned, and the validity period differs. World Aeronautical Charts are valid for one year. The date the next edition is scheduled is printed on the front panel.
Airport – Facilities Directory
The Airport – Facility Directory is a comprehensive descriptive listing of every airport, heliport, and seaplane base in the U.S. that is open to the public. It is published every 56 days by the National Ocean Service (NOS). There is so much information in these documents that seven regional volumes are required to cover the lower 48 states. It's indexed by state then city.
The illustration below is part of the header in the Directory for the Nantucket, Mass. Memorial Airport. Everything you ever wanted to know about an airport is contained in this publication: airport sketches, Navaids, communications data, weather data sources, airspace, special notices, and operational procedures. It includes data that cannot be readily depicted in graphic form: e.g., airport hours of operation, types of fuel available, runway data, lighting codes, etc.
It also provides a means for pilots to update visual navigation charts between editions dates; i.e., the Airport/Facility Directory is published every 56 days while the VFR Sectional and Terminal Area Charts are generally revised each six months. This is an inexpensive publication, like charts, and is worth purchasing.

This is a portion of the Nantucket Memorial header in the Airport Directory.
The narrative for the first line is, Airport name, three-letter airport designator, airport is 3 nm. south-east of Nantucket city center, and the local time is five-hours earlier than UTC (four hours earlier when daylight savings is in effect). Not shown, but farther to the right on the first line is the longitude and latitude of the airport and the identifying numbers for the sectional chart, the low-altitude IFR chart, and the high-altitude enroute chart that contains Nantucket.
The second line: the airport elevation is 48 ft. above MSL, B means a rotating beacon is present, S4 is the level of aircraft maintenance available (nice to know in case the rubber bands break under the cowling), 100 Low Lead gasoline available, Jet A kerosene fuel available, and ARFF index A indicates the level of fire-fighting and rescue equipment that is available.
Then follows nearly a full page of additional information. Click here to download the full description for Nantucket plus the directory legend explaining the header data.
An unofficial version of the airport/facilities directory is available online. I'm not certain if it's suitable for "real" navigation, but it's great for flight-simmers. The website is at www.airnav.com.
IFR charts are the next topic. Use the IFR Enroute Low Altitude Chart for IFR flight below 18,000 feet (same title in Canada) and the high altitude enroute chart above that. Click on the IFR Charts button below to move on.
Site best viewed at 600 × 800 resolution or higher.
© 1999 – 2008, Charles Wood.