Plot a Course
Not a good feeling. Good preflight planning helps keep that sinking feeling from your stomach.
In this section, you'll learn the basics of plotting a course. Two routes are proposed, one in a no-wind situation and the other with a serious wind. After plotting each and calculating the various factors, you'll fly the respective course.
Once you learn the basics, you can download (Downloads section) the software that will flight-plan for you.
Enter Mr. Benjamin Counter
The line boy pulled the fuel truck alongside as I cut the C182's engine. I had just taxied in after a flight to Boston to pick up some badly-needed spares for our charter aircraft fleet. I was looking forward to relaxing with a Coke in the Pilot's lounge when the line boy waved me over, reeling the fuel hose from the truck.
"The Boss told me you should see him the moment you landed," he shouted.
I thanked him and groaned inwardly. The Boss missed his calling—should have been a drill sergeant. He was strictly a "type-A" guy ... "Those who agree with me say I, those who disagree, say I resign." Some call his management style "My Way or the Highway."
"Expected you earlier," was his greeting as I walked into his office. I sat down without responding. As chief pilot of this all-charter operation, I knew that silence in these situations was the only thing that kept me employed.
"As soon as your ship is fueled, I want you to pick up a Mr. Benjamin Counter at New Bedford and fly him to Fishers Island. He's the CEO for an airline here in New England and is a workaholic. He's looking for some property for a second office, to get away for some undisturbed weekends. Supposedly does his best work then—no phones or people to disturb him. Difficult guy to work for, I heard. Itll be just him and an administrative assistant to help with whatever duties may arise."
"He could be a good customer for us if we treat him right," he commanded. "Apparently three other charter outfits didnt because he fired them all. Keep him happy." On that optimistic note he dismissed me with a wave and returned to his mound of paperwork.
So there it was; a flight from New Bedford, Massachusetts to Elizabeth Field, on Fishers Island, just south of New London, Connecticut—your first opportunity to plot a course and test your skills by flying it. The figure below shows the flight path.
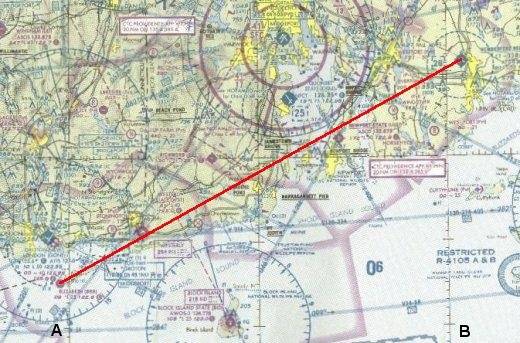
Portion of New York sectional used for first flights. Don't have that sectional?
Click on the image to download the gif file—without the course plotted.
If you don't have a New York sectional, click the image to download a gif file—zipped—of the portion of the chart needed for this flight. It was scanned at 300 dpi, and is 7.0 in. by 9.5 in. Most likely you will need to resize it before you can use it. Here's how to do that.
Print the gif file at 100 pct size. For the scale to exactly match a sectional's, the distance between the two vertical grid lines, marked A and B, should be 167 mm, or 6-9/16 inch.
Now, suppose the distance on your printout between those grid lines is 164 mm. You must resize the picture to make it larger ... 167 mm / 164 mm = 1.018. Resize the image by that factor and print it out again. It should be right on the money.
Flight Planning Worksheet
Use a Flight Planning Worksheet to organize all of the pertinent flight information. Print out the blank forms by clicking here. Acrobat will pop-up with the form, then open it, click on "File," then "Print."
The first entry on the form is at the top-right. Put the aircraft's True Air Speed here. For the C182 Nav Trainer, that will be 110 kts. Note that all speeds are in knots. Then fill in the date, the Departure Airport (New Bedford), and the Destination Airport (Elizabeth Field).
Lastly, enter the destination airport information on the bottom of the form. You don't want to be searching for this information while flying, as you are setting up for the approach. Go to www.airnav.com for the Elizabeth Field info. Retrieve the three-letter airport designator (0B8), the field elevation (9 ft), and the runway information (Rwy 7-25, 1792 ft. and Rwy 12-30, 2328 ft.). Record this information on the bottom of the worksheet.
Click here to view the worksheet with the preliminary information filled in.
Let's plot the course and continue filling in the Flight Planning Worksheet.
- Draw a course line on the chart from New Bedford Airport to Elizabeth Field. Run this line through the center of the two airport symbols. Use a soft black pencil for good visibility of the course line and so that you can easily erase the line when ready to plot another flight.
- Measure the distance along the course-line between the centers of the airport symbols. Be certain that the nautical-mile side of the plotter is up.
- The distance should be 54.5 nm. Record this as leg 1 on your flight log.
- Position the top edge of the plotter, where the mile marks are, along your course line of flight. Move the plotter left or right along the course line until the center-point of the protractor lays exactly on a meridian line. A meridian line is one of the north-south grid lines. The center-point of the protractor is the zero-miles point on the distance scale, in the middle of the ruler. Then read the angle from the outer scale of the protractor where it overlays the meridian line. Use some thought in interpreting this number. See the figure below.
- For our flight, the meridian line is under the 241° point. This is the TRUE course of our flight. Record it on the worksheet under the heading "TC."
- For flights that are too northerly or southerly for the protractor to fall on a meridian line, read the angle from the smaller protractor inside the main protractor. Again, position the plotter on the course line. Move it left or right until the center point of the protractor exactly falls on a HORIZONTAL grid line. Then read the angle from the small protractor that overlays the horizontal grid line.
- The main protractor is marked E-W, meaning use it for flights that are generally easterly or westerly. The inner protractor is marked N-S meaning use it for flights that are mainly northerly or southerly. Keep your wits about you though, and think about the protractor reading to be generally satisfied that you have the correct number.
Measuring the true course, New Bedford to Elizabeth Field.
There now are two more data points for the worksheet: the distance, 54.5 nm. and the true course, 241°.
Determining the effects of the wind on the course would normally be the next calculation, but this first flight is in calm air. So put dashes in the wind speed and direction columns, as well as in the wind-correction-angle column, "WCA." The next flight will consider these factors.
With no wind to contend with, there is no wind-correction angle, and the True Heading (TH) is the same as the True Course (TC) or 241°.
Similarly, since there is no wind, the Ground Speed (GS) will be the same as the TAS, or 110 kts.
Let's take a look at how the worksheet looks up to this point. We'll use Adobe's Acrobat Reader to view the progression of the worksheet. by clicking here.
Magnetic Variation
As most will recall, either from the old days in school, or more recently, the Magnetic north pole on earth is not the same place as the True north pole. Since we fly by the compass, which points to Magnetic north, we have to adjust the aircraft heading, which is based on the compass reading —the Compass Heading—to be on the correct True Heading.
The map below shows the variation in the U.S. between a compass reading and true north.
Magnetic Variation, isogonic lines, across the U.S.—Westerly variation
means that the compass points west of true north.
Sectional charts show isogonic lines for every one degree of magnetic variation. An isogonic line is a line drawn through points of equal magnetic variation. On the New York Sectional an isogonic line passes through Block Island Airport.
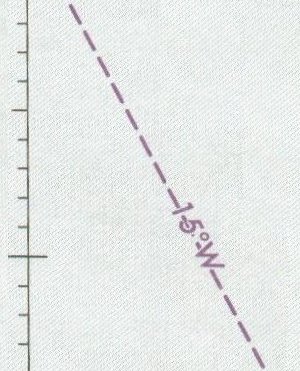
![]() The magnetic variation for an isogonic line is written along the line, as this illustration shows, and is normally positioned near the bottom of the chart.
The magnetic variation for an isogonic line is written along the line, as this illustration shows, and is normally positioned near the bottom of the chart.
The isogonic line shown also is the one that crosses our flight path from New Bedford to Elizabeth Field. So we have to factor this into the aircraft compass heading to track the true 241° course plotted from the chart.
The question is, add the magnetic variation to the compass heading, or subtract it? Well, there is a rule for that, and another memory aid. But there is an easier way to decide. The clue lays right in front of you, on the sectional chart.
Recall in the sectional chart discussion in a previous section the mention that the symbol for a VOR was a compass rose with an arrow pointing towards magnetic north. A glance at a VOR near our flight path will give us the add or subtract answer.
Note the Sandy Point VOR in the illustration at Block Island. The isogonic line passing right over the airport is 15° west. Since it is a west variation, magnetic north points west of true north, and that is evident in the illustration.
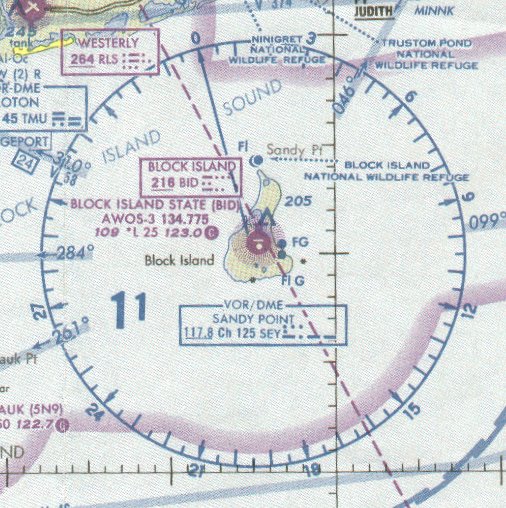
Sandy Point VOR compass rose, Block Island airport. The VOR 0° radial
always points to magnetic north.
Assume your aircraft is flying over Block Island airport along the 0° VOR radial, which is magnetic north. True north is indicated by the meridian line just east of the airport. For the aircraft to head true north, it must turn right to parallel the meridian line. Right turns always adds numbers, so the 15° that the aircraft had to turn is added to its true heading. In this case the compass will show 15° when the aircraft is flying true north.
Just look at a VOR, decide whether to turn right or left from the 0° radial to head true north, then add the magnetic variation if it's a right turn or subtract if it's a left turn.
The easily-remembered memory aid is "East is Least," meaning if the variation is East, subtract the variation from the true course to get compass heading.
The compass heading from New Bedford to Elizabeth Field will then be 256°, or 241° true course plus 15° magnetic variation west.
Choose an altitude. If the flight is long, consider the effect of the winds aloft when choosing an altitude. For the moment, we'll ignore them and just choose the altitude based on magnetic heading, westerly. The flight is brief and VFR, so fly at 4500 ft.
Estimated Time En Route
The final steps in the flight plan is to calculate the Estimated Time En Route, ETE, and fuel used.
| Distance [nm.] × 60 | ||
| Estimated Time En Route [Minutes] = |
|
|
| Ground Speed [kts.] |
First, the data needed:
- First leg distance: 54.5 nm.
- First leg true heading: 241°.
- Cruise altitude: 4500 ft.
- True Air Speed at 4500 ft.: 110 kts.
- Climb speed, 90 kts.
- Rate of climb: 700 fpm.
- Descend airspeed: 110 kts.
- Descend rate: 500 fpm.
- Fuel consumption, cruise, 20 gallons per hour.
- New Bedford field elevation: 80 ft.
- Elizabeth Field elevation: 9 ft.
There are two methods of calculating ETE, Estimated Time En Route. The first method is for the purists, or for those who have pulled their 747 out of the garage for a weekend flight and will be cruising at FL390.
- Calculate the time to climb to cruise altitude.
- Calculate the time to descend to the destination runway.
- Calculate time for the remainder of the flight at the cruise altitude.
- Add the three time calculations for ETE.
Since this first flight is assumed in a zero-wind situation, the ground speed will be the same as the air speed, and the course heading is not a factor in the ground speed. Also, since the departure and destination field elevations are less than 100 ft., they will be ignored for ETE calculations, too.
Time to climb to cruise altitude = 4500 ft. / 700 fpm = 6.4 minutes or 0.11 hrs.
Distance covered during climb = 0.11 hrs. × 90 kts. = 10 nm.
Time to descend = 4500 ft. / 500 fpm = 9 minutes or 0.15 hrs.
Distance covered during descent = 0.15 hrs. × 110 kts. descent = 17 nm.
NOTE: Since we descend in the Nav Trainer at 110 kts, also the cruise speed, we wouldn't calculate descent time separately.Balance of flight at cruise altitude = 54.5 nm. minus (10 nm. climb, + 17 nm. descent), = 27.5 nm. at cruise altitude.
Time at cruise altitude = 27.5 nm./110 kts. = 0.25 hrs., or 15 minutes.
Therefore, the ETE is:
Time to climb 6 minutes Time to descend 9 minutes Time at cruise altitude 15 minutes ETE 30 minutes ETE ... Method 2
D / TAS plus 5 minutes35 minutes Second method to calculate ETE: calculate the time to fly entire distance at cruise speed.
= 54.5 nm. / 110 kts. = 0.495 hrs. or 30 minutes.
Add 5 minutes for climb and descend. With this method, the calculated ETE is 35 minutes; 5 minutes longer than the "precise" calculation. For longer flights, this second method of calculation becomes more accurate.
At low cruising altitudes in VFR weather, the second method is very acceptable for calculating ETE.
The final calculation is the fuel consumption. The second method of calculating ETE will suffice for the time aloft to calculate fuel consumption. If you're piloting an airliner flying at high altitudes, as all airliners do, the fuel consumption should be calculated for climb in addition to cruise, as the climb fuel consumption rate is much higher than the cruise consumption rate.
ETE = (54.5 nm / 110 kts) + 0.083 (5 min. for climb and descent) = 0.58 hrs.
20 gph × 0.58 hrs = 11.6 gallons of fuel used for the flight.
Now click here to see the completed Flight Planning Worksheet for the first flight, New Bedford to Elizabeth Field.
Flight Planning Summary
- Enter route information on planning sheet.
- Enter destination airport information on planning sheet.
- Plot the true course on the sectional.
- Measure the distance in nautical miles from the departure airport to the destination airport. (Or between checkpoints.)
- Determine the true course heading with a plotter.
- Select the cruising altitude (based on magnetic course).
- Determine the Wind Correction Angle (WCA) and then the True Heading (TH).
- Add or subtract the magnetic variation (VAR) to determine the Compass Heading (CH).
- Calculate the ETE—Estimated Time En Route.
- Calculate the amount of fuel used.
Follow those ten steps for each leg of a flight.
Now let's fly the course!
Start the panel-mounted timer as you lift off from New Bedford's Runway 23 and stop it as you touchdown on Elizabeth Field's Runway 25. Compare your actual flight time against your calculations. You'll enjoy flying this aircraft with the oversize gauges.
Well, that was an interesting flight and mathematical exercise, but hardly one shrouded in realism. It was, though, a good stepping stone to handle the real-world issues of winds aloft, and their affect on navigating from point A to pont B.
Winds aloft affect both the ground speed of the aircraft, and the heading that the aircraft must fly to stay on the desired true course.
Time to Debunk Another Myth
Some pilots contend that a strong headwind is not a concern because the lost time will be gained on the return journey, when benefitting from the tailwind. The truth is, for a constant wind situation, the effects of a headwind cannot be reversed by the tailwind on the return trip. A simple calculation will end the discussion on this subject.
For illustration, assume a 180 nm. journey, a 60 kt. headwind, and an aircraft that cruises at 150 kts TAS.
The ground speed into the headwind will be 150 kts. minus 60 kts. wind or 90 kts. Time to fly the 180 nm. will be 180 nm. / 90 kts. ground speed, or 2.0 hrs.
For the return trip, ground speed will be 150 kts. plus 60 kts. tailwind, or 210 kts. Time to fly the return trip will be 180 nm. / 210 kts., or 0.86 hrs.
Total flight time with this wind situation = 2.0 hrs. + 0.86 hrs. = 2.86 hrs.
Now consider the no-wind journey. Still 180 nm. each way, total 360 nm. TAS of aircraft is 150 kts. Therefore total round-trip time, with no wind, will be 360 nm. / 150 kts. TAS, or 2.4 hours—0.46 hrs. shorter than flying with the headwind and tailwind.
Try the calculation for any distances, any TAS, and any wind speed. The results remain the same. The effects of a headwind can not be overcome by the same tailwind.
The Second Flight and more of Mr. Benjamin Counter
"What did you do to Mr. Counter?" the Boss shouted. "He gave me an earful about your violent antics while landing at Fishers Island. Said your jerky maneuvers almost threw him out of the plane."
'Violent antics?' If I knew it would come to this I'd have barrel-rolled out.
"The deer that ran onto the runway as I was about to flare out left me with two choices," I replied, evenly. "It was either venison steaks à la propeller blades at the expense of your sparkling-new Nav Trainer, or go around from a near-stall and put up with Counters complaints—tough decision, but I chose the latter."
"He didn't mention a deer. Anyway, hes giving us, you, one more chance, so dont botch it. He needs to get from Lawrence Airport to Worcester—this afternoon. His stock broker is in the Worcester office with a hot trade recommendation, but Counter wants to talk to him about it in person before the market closes.
"So give Counter a nice smooth flight and we might keep him as a customer," the Boss finished.
A nice smooth flight? A strong cold front had just raced through early this morning leaving very brisk north-westerly winds in its wake. Flying low and slow will be very bumpy.
Can't worry about that now. The flight originates at Lawrence, Mass., airport ID KLWM, then southwest to Worcester, airport ID KORH. Time to plot it and move on.
The illustration below shows the route of flight, which is still wholly contained on the New York sectional chart. A click on the image will download a zipped file of the same portion of this sectional for those without the chart. Go to the Downloads Section if you have a color printer.
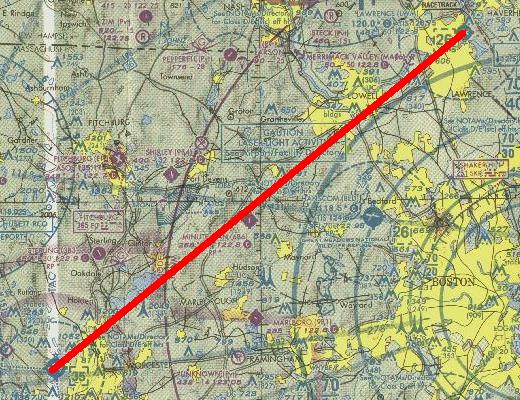
Second flight, Lawrence, Mass. to Worcester, Mass. Click the image for the GIF file, without the course plotted, if you don't have the New York sectional.
Again, check the print-out of the sectional for faithfulness in size. The distance across two grid-squares should be 166 mm.
Print and begin a new Flight Planning Worksheet for this second flight. On the sectional plot the true course from Lawrence, Mass., KLWM, to Worcester, Mass., KORH.
Enter that information, along with the Worcester Airport, KORH. data onto the worksheet.
The winds aloft are 315° at 40 kts. That goes on the worksheet, too. Note, winds aloft commonly vary depending on altitude, but for this example they are considered constant regardless of altitude.
Now click here to see the Worksheet containing this initial data. If your results differ, recalculate or remeasure to find the problem. If your work is OK, and I messed up, please e-mail me and I'll correct whatever is wrong.
The Famous Wind Triangle
We draw a triangle on a sheet of paper to determine the wind correction angle (WCA) and ground speed (GS). It is a simple, six-step process that takes less time to do than to describe. Best of all, it's an approach that works whether the flight is simple or complex.
Begin by orienting the paper in the direction of the flight. For an east or west flight, the long side of the paper should be horizontal. For a north or south flight, turn the long side vertically. Use a separate sheet for each leg of the flight.
A conventional ruler or scale and a protractor will work fine for this work.
Now the steps of the wind triangle.
1. Draw a vertical line representing a meridian line. In this instance, the line is to the right of the paper and to the top since the aircraft's true course on the first leg is south-westerly. Want to leave room on the page for plotting.
2. Next draw the vector for the wind. Use any scale, but keep it consistent for all vectors. I find 1 mm = 1 kt a workable scale. Wind FROM the north-west, 315°, is wind going TO the south-east. Measure all angles carefully.
3. Draw the vector for the True Course. Here it is 230°. The line should be "long" as the pertinent length will not be known until the third side of the triangle is entered, on the next step.
4. Put in the TAS vector. In this example, it is 110 units long for 110 kts. Hold the "zero" of the ruler at point A and rotate the ruler until the 110-unit mark intersects the True-Course vector, here at B. Draw the line from A to B. The triangle construction is now complete.
5. Measure the distance along the True-Course vector, from point X, the origin, to point B, where the TAS vector intersects. This distance is the aircraft's Ground Speed. In this case, it is 99 knots.
6. To determine the Wind Correction Angle measure the inside angle at B, between the True-Course Vector and the TAS vector. Here the angle is 21°. If the wind is from the right of the aircraft, add the WCA; if from the left, subtract the WCA. In this case, the wind is from the right, so the WCA is plus.
In summary, here are the steps to build a wind-triangle and then determine the aircraft's Ground Speed and Wind Correction Angle:
- Draw a vertical line on a sheet of paper to represent a meridian line.
- Draw the wind vector, faithfully reproducing its velocity and wind direction. Remember that winds are reported "from" a compass heading and 180° must be added to that when drawing the vector.
- Draw the True-Course vector from the point of origin between the meridian line and wind vector.
- Draw the TAS vector with its origin at the end of the Wind vector. The ruler should be rotated about that point until the no of units of TAS intersects the True-Course Vector.
- Measure the distance along the True-Course vector between the two points of intersection. That will be the Ground Speed.
- Measure the angle inside the point where the TAS vector intersects with the True-Course vector.
After you've drawn two or three wind triangles, you'll find you can complete the process in about 3 minutes.
Download the completed worksheet, flightplan-lwm1.pdf, from the Downloads Section.
Microsoft Complicates the Flight-Planning
Normally, at this point you should be ready to enter the winds into the MS Flight Simulator and start the flight. But recall that the weather dept. reports Winds Aloft in true direction, so that we can flight plan using true course, and reports surface winds in magnetic direction, since runway headings are magnetic.
Flight Simulator specifies ALL winds in magnetic, so an additional calculation is needed before the flight plan is completed.
We must convert the Winds Aloft to their equivalent Magnetic direction to properly set up Flight Simulator.
Add the Magnetic Variation to the Winds Aloft True direction if the variation is West, as it is here, or Subtract the Magnetic Variation from the Winds Aloft True direction if the variation is East.
For this flight, the wind's magnetic direction = 315° true + 15° variation = 330°. So, to properly set up Flight Simulator, enter a wind of 40 kts from 330°.
Now climb into your Nav Trainer, with the Flight Sim weather set for a wind of 40 kts from 330°, note the headings, etc., in your Flight Planning Worksheet, and be on your way. Start the panel stopwatch as you roll down Lawrence Airport's Runway 33 and stop it after touchdown at Worcester. Compare your flight time with the predicted flight time.
Be sure to use the proper runway at Worcester. Land on Runway 33, not Runway 29. With this very strong wind, you could not keep the aircraft on the runway using any runway except 33.
And enjoy the flight. Give Ben Counter a nice ride.
The Great Microsoft Flight-Sim Wind Software Bug ... FS-98 Only
Unfortunately, you can't simply set the wind speed and direction of the wind in FS-98, then take off from the airport. In FS-98, because of a serious software bug, an aircraft on the ground will rotate to point into the wind, or "weather-vane." Makes no difference whether the engine is on or off or the brakes are set or not. In this example, with a wind of 40 kts. from 270° the nose of the aircraft will slide around until the compass shows a heading near 270°. Sometimes you will be lucky and that heading is approximately aligned with the runway. Other times, it could be 90° to the runway.
The solution? There are two, neither good.
- Take off regardless of the alignment of the aircraft with the runway. Shortly after the aircraft is airborne, turn to the runway heading, correcting for the effects of the crosswind. I use this method, and have mostly avoided crashing into terminal buildings, other parked aircraft, or mountains.
- If you have a strong desire to taxi the plane to the runway, the method above will not work. It is practically impossible to adequately control the direction of the aircraft while taxiing with any level of wind. So turn off the wind, take off, then turn the wind back on shortly after take-off.
Some aircraft don't exhibit this property, in which case you can do everything "right."
FS2000 and FS2002 are both greatly improved against weather-vaning while sitting on the ground, but have some tendency to turn into the wind when airborne.
Alternatives to the Wind Triangle
While pencil, paper, ruler and protractor offer a simple, accurate, and quick method to calculate Ground Speed and Wind Correction Angles, more convenient devices have evolved over the years. Probably the most well known is the Dalton E6-B flight computer. The E6-B is basically a circular slide rule with a sliding tab for wind calculations. With practice, it can be manipulated with one hand, certainly a consideration when piloting an aircraft faced with an unplanned change of route.
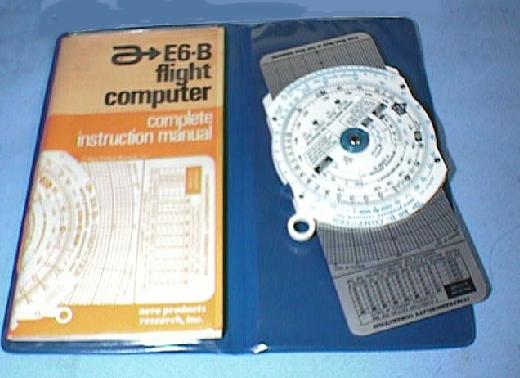
Millions of pilots have trained on the E6-B flight computer.
The E6-B has been around a long time. Philip Dalton invented it in the early 1930s. During WWII, it was engraved brass, later plastic. Today, one can purchase aluminum, plastic, or cardboard models. Buy one if you are into realism and nostalgia. Try eBay and other auctions for better quality units at decent prices.
The Virtual E6-B
For ease, simplicity, accuracy, and speed, the flight-simmer should try the virtual E6-B. It is a freeware software program that calculates the Wind Correction Angle, Ground Speed, and a host of other things. See the illustrations below for the calculations just performed using the wind triangle.
Click here to download this handy utility.
The opening panel of the Virtual E6-B shows the many options available.

On the left, input numbers have been entered. On the right, results computed.
With the basics of plotting and flying VFR courses behind us, the next step is instrument work. We'll begin with the Non Directional Beacon, NDB, because once you have mastered that work, you can handle all of the other IFR work with ease.
True Air Speed Vs. Indicated Air Speed
By now you will have noticed that all of the flight calculations involve "True Air Speed," TAS. Air Speed Indicators routinely display "Indicated Air Speed," IAS. The ASIs on Flight Simulator default into the IAS mode. ASIs become inaccurate as an aircraft climbs primarily because the air becomes thinner. So if your ASI displays 110 kts at 7500 ft altitude, your True Air Speed is actually higher.
Here is the rule of thumb to convert Indicated Air Speed to True Air Speed
Add two percent to the IAS for every 1000 ft above sea level.
Assume that your IAS is 110 kts, and you are flying at 5500 ft.
- At 5500 ft, two percent for every 1000 ft would be 11 percent.
- Eleven percent of 110 kts (your IAS for this example) is 12.1 kts
- Thus, at 5500 ft cruise altitude, your TAS is 110 kts + 12 kts, or 122 kts!
For short flights, the difference between IAS and TAS will not significantly impact your ground speed or Estimated Time En Route, ETE. For longer flights, it has a dual impact:
- Using IAS instead of TAS will give you the wrong ground speed and the wrong Estimated Time En Route
- Using IAS instead of TAS will give you the wrong Wind Correction Angle, WCA
Compare the differences below when using IAS vs TAS for the calculations in the example flight from Lawrence, Mass. to Worcester, Mass.
The flight conditions for these calculations are:
- Wind: 315° at 40 kts
- 5500 ft. cruise altitude
- 230° True Course
- IAS at 5500 ft: 110 kts.
Flight Calculation Using 110 kts IAS Using 122 kts TAS Ground Speed 99 kts 112 kts Wind Correction Angle 21° 19° If your destination airport is 120 NM distant, using the 110 kts IAS for calculations instead of the correct 122 kts, you will arrive eight minutes earlier than planned. More significantly, you will be two degrees off course, which is about 4 NM. That's not real serious in good visibility when landing at an easy-to-find major International Airport. Missing a small grass airstrip by four miles in reduced visibility means you may not find it at all. More than a little embarrassing if it's an FAA examiner sitting next to you.
Handy Sheet 3.0
Before going to the next section, there is one last nugget to pass along. It's Wagner B. Beskow's Handy Sheet 3.0, http://www.geocities.com/CapeCanaveral/Hall/7704/
Here is what's on this one-page reference guide for all your simulated flights:
Main Features
Diagrams
- Approach and Landing Speeds
- 45° and 80° Procedure Turns
- Koch Chart (effect of temperature and altitude on takeoff distance and rate of climb)
- Fuel, Air Pressure and Distance Conversions
- Wind Components (obtain head/tailwind and crosswind components)
Tables
- Approach and Landing Speeds;
- Glide Slope;
- Phonetic Alphabet;
- Reciprocal Runways;
- Temperature Conversions and
- RULES OF THUMB on how to quickly obtain:
- TOD (top of descent)
- Descent Rate
- Descent Altitude check
- TAS (True Airspeed)
- Bank Angle and
- Rollout Angle
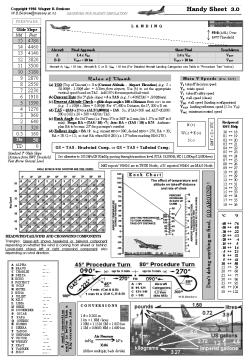
All that plus a few extras on a single A4 page to eliminate cockpit clutter and pilot distraction. Applicable to any aircraft.
Click on the image for expanded view.
Download the Handy Sheet, MS Word 97 version here.
Don't have MS Word 97? Link to Microsoft's free Word Viewer, wd97vwr32.exe.
A bitmap version of the Handy Sheet is also available, but at lower resolution. Click here for the bmp version.
Course vs. Track
Before moving on, it's worth reinforcing the difference between Course and Track. Your course is the path of flight that you have plotted on a chart. Your track is the actual route that your aircraft covers when flying from point A. to Point B. Because of wind, or drift for other reasons, your track can differ considerably from your course.
Simply remember that course vs. track is intention vs. reality.
The Earliest Navigation Aids
NDB navigation is the next topic. It was a major breakthrough for airlines and enabled them to meet schedules almost without regard to weather. But there were aids to navigation before the proliferation of NDBs. Read how it all began in the next section. Learn about the early progression of navigation aids. I think you'll find it fascinating and you'll marvel at how well the early pilots did with these systems. Pioneering will have a new meaning.
Click on How it Began below to move on.
Site best viewed at 600 × 800 resolution or higher.
© 1999 – 2002, Charles Wood.