IFR Charts
As might be expected, IFR Enroute Low Altitude charts differ significantly from their VFR counterparts. Since an aircraft on an IFR flight plan is likely to be touting about in the soup, terrain features are not too important. A quick glance at an IFR chart verifies this. Lakes and rivers are vaguely visible; essentially no other terrain features are shown.
The IFR chart and the VFR chart differ to the degree that one could almost believe that the two issuing departments don't speak to each other. Start with the coverage map on the front panel.
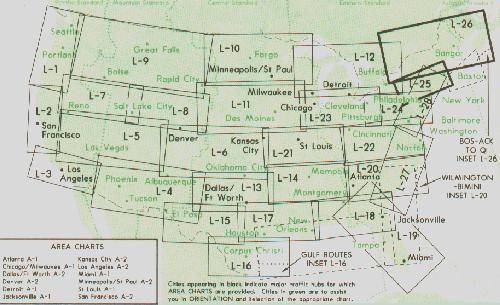
Coverage of Low Altitude Enroute Charts. Click image for larger view.
To begin, gone are the symmetrical areas covered by sectional charts. Some charts cover very large areas, such as L-9, while others cover a small area, see L-3. No grayed-out areas to indicate which chart is in hand, either—been replaced with a heavy border.
Note that low-altitude chart titles begin with the letter "L," and of course the high-altitude chart titles start with the letter "H." Forget about a cool name to help understand the coverage area, too. Just numbers.
Maybe not so surprisingly, IFR Area Charts are also available. The note below explains: (More easily understood viewing the larger image of the chart coverage.)

This note is on the lower left of the coverage chart.
Looking at the expanded view of the coverage, note that twelve area charts are available. Surprisingly, there isn't one for the New York area. Presumably all traffic is under such rigid ATC control there that an area chart would only be an amusement.
One very important point before moving to the inside. The scale of IFR charts. No more 1:500,000, etc. L-25 is one-inch equals eight nautical miles. At last, distances that can be measured with a common ruler. But wait. L-26, which is on the reverse side of the chart, has a scale of one-inch equals sixteen miles.
L-26 has a Boston – Nantucket – Yarmouth inset with a scale of one-inch equals 40 nm.
Not to worry, though. All pertinent distances (in nm) are printed on an IFR chart. Just be careful when "eyeballing" distances because of the way the scale bounces around from chart to chart.
On to the inside. Like the sectional, IFR charts are printed on both sides, but with a difference. One "L" chart is on one side, and another "L" chart is on the other side. Unlike the sectional chart, which one flips vertically when navigating from the front of the chart to the rear, one flips an IFR chart horizontally. Flip it vertically and you'll be reading it upside down. Well, maybe "reading" is too strong of a word. Cussing may fit better if you fly both VFR and IFR. Apparently what's good for the goose is not good for the gander.
Let's stay near the Nantucket airport.
IFR Chart excerpt near Nantucket. Click on image to download and print
high-resolution pdf file.
Many of the features on the IFR chart are similar to those found on the sectional chart. Compass roses are shown for VORs and the NDB symbol remains unchanged, also.
The navigation boxes for ACK VOR and TUK NDB are very similar to sectional chart notation, but with one addition. The longitude and latitude of these nav-aids are listed so that pilots may enter that data into their GPS receivers.
The information adjacent to the Nantucket Airport is in slightly different format, but still easily deciphered: name, Nantucket Memorial, it's in Class D airspace, 48 ft. field elevation, lighted runways, longest runway 6300 ft., ATIS available on 127.5 MHz.
Restricted area R-4105A,B is shown southwest of Martha's Vineyard.
The Bold 2o NE of Martha's Vineyard is the obstruction clearance altitude for that grid on the chart.
The Victor airways are identified. Note V 146. Still shows the 27 nm. from ACK to MVY. The 2000 above the V 146 is the minimum altitude on that airway to guarantee obstacle clearance and reception of signals.
The triangle along V 46, the 270° radial from ACK VOR is an intersection. It is named "CLAMY" and is defined by the 180° radial from MVY. It is 24 nm. from ACK.
The next feature is not seen often. Move to just west of the ACK VOR, to the TUK NDB. Note the airway inbound to the NDB with a 324° bearing. It is named A632. That is a Low Frequency Navaid airway. In this case, an oceanic airway. Minimum reception altitude is 18,000 feet and it is 195 nm. to the SLATIN intersection.
Move to the 349° radial of ACK. Note the GROGG intersection on that radial, 12 nm. out from ACK. CRACO is the next intersection on the same radial, another 5 nm. out from the VOR. The distance of the two segments, 12 nm. to GROGG and 5 nm. to CRACO is 17 nm. CRACO intersection can be established two ways: the intersection of the 080° radial from MVY with the 349° radial from ACK, or the 17 DME point from ACK. The 17 enclosed in the box as shown near CRACO denotes a DME fix.
Any intersection with an arrow adjacent to it can also be established by the DME mileage from the VOR.
It's time to plot a course and do some flying! Click on the Plot a Course button below to move on.
Site best viewed at 600 × 800 resolution or higher.
© 1999 – 2002, Charles Wood.